Two runs were considered. Run 170 was done for high-energy pions at approximately 150 MeV/c momentum and 500 Hz trigger rate. Run 199 was done with surface muon beam at trigger rate $450\mu^{+}/2700e^{+}$ Hz. High voltage on chambers was 1850 V for both runs. New version of front-end was set to 140 mV threshold. TDCs window was set to 8191 channels.
At the beginning of the analysis several restricting checks of trigger
data and number of hits in chamber were made before event was accepted
for further analysis. Event was skipped if any of these checks failed.
List of tests is presented in Table 1
| Table 1 | |||
| Test ## | description | RUN 170 (pions) | RUN 199 (muons) |
| 1 | There is only ONE hit in TDC module from LARGE scintillator. This removes many events with two or more tracks in chamber in one event. | ON | OFF |
| 2 | Arrival time of the LARGE scintillator signal is within $\approx 3\mu s$ delay time ($t_{LS}<6300 ch.$) This test also rejects extra tracks arrived not in coincidence with start. | ON | OFF |
| 3 | Number of fired cells in each chamber plane does not exceed 4. This excludes most of external noise when whole plane is firing. | ON | ON |
| 4 | There is no signal from LARGE scintillator This rejects most of positrons in surface muon beam. | OFF | ON |
| 5 | There is only ONE hit in TDC module from SMALL scintillator. This excludes many muons in one event. | ON | ON |
| 6 | Arrival time of the SMALL scintillator signal in window ($t_{SS}<6300 ch.$), similar to test #2. | OFF | ON |
The lower-right plot on Fig.run170hits presents the beam profiles for all 7 (X and Y) planes.In this scatterplot each fired cell in event was counted only once even if there were multiple hits on wires. Number of hits in event distribution has a sharp peak at 7 (i.e. one hit per plane). Counts for number of hits less than 7 are not due to inefficiency of chamber - in most cases they come from tracks going close to the edges of instrumented wires (16 for Y-planes and 24 for X-planes).
Figure run170hits:
Number of hits distributions and beam profiles
for pion beam at 150 MeV/c.
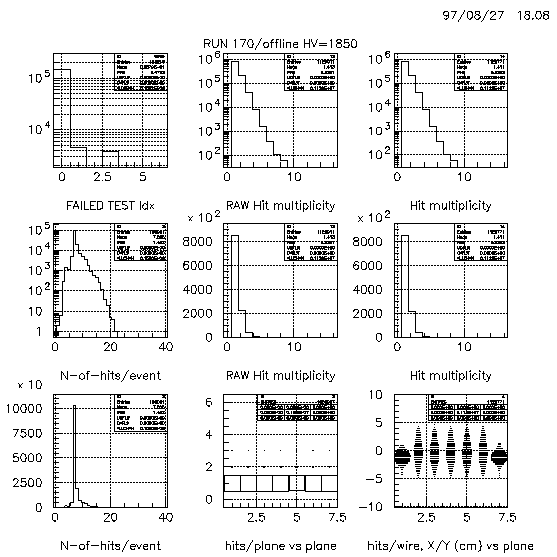
Figure:run170tdcwidth:
TDC pulse width distribution for signals from wires.
Only first arrived pulse on wire in [0,6300] channels window is accepted
and put into histogram.
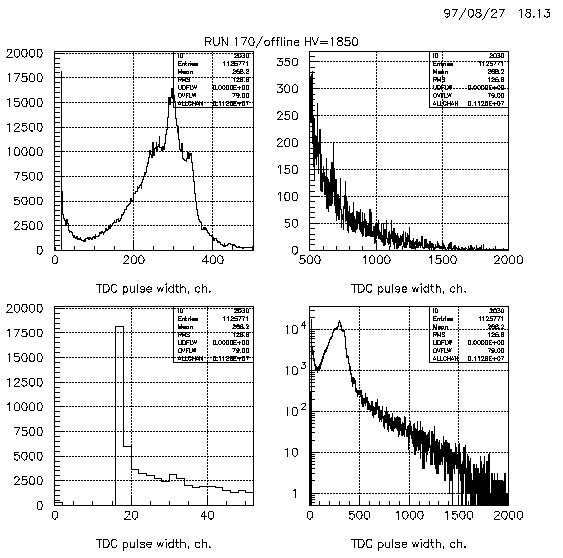
Figure:run170tdcwidth-vs-time
Correlation between the width and
arrival time (TDC channel) of hits in event.
Only one (first arrived) hit is
taken for each fired wire, plane 0 here means hits in
all planes are put in this histogram.
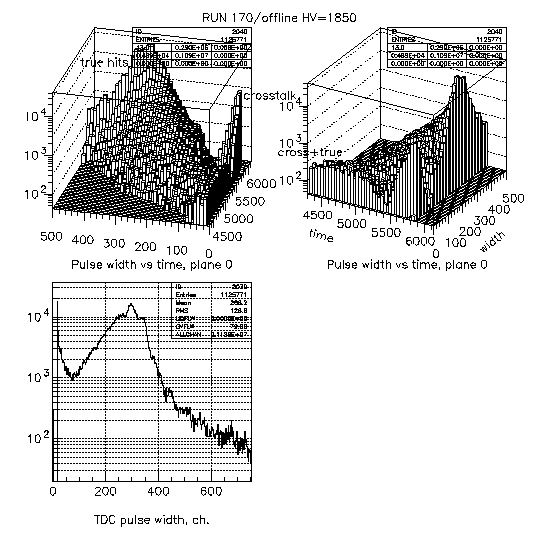
An attempt was made to exploit these correlations in further analysis. Most of crosstalk is caused by big pulses from tracks going close to wires and these true pulses tend to have large width. Another crosstalk feature is that it comes almost simultaneously with the source pulse. Two scatterplots on Fig.:run170cross-vs-source (upper and lower left) show the distribution of pulse widths in event (hits in all planes considered) arrived in coincidence ($\pm 10$ channels) with the longest pulse in plane 2.
Figure::run170cross-vs-source
Width of
pulses (refered as ``crosstalk'') arrived in coincidence ($\pm 10$ TDC
channels) with the longest pulse (refered as ``source'') in plane 2 versus
the source pulse arrival time (upper-left) and width (lower-left).
Drift
time spectra (upper-right) from selected wires in plane 2 and correlation
scatterplot (lower-right) of their drift times when both wires fired in
event.
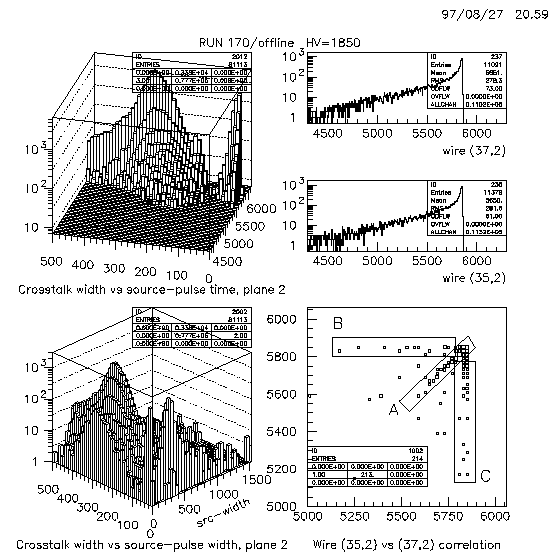
Of course, a rule used to fill these scatterplots
does not exclude all pulses from ``true'' hits, because, at zero degree
incidence angle tracks pass at approximately the same distance from wires in
all even (non-shifted) planes and similarly in all odd planes, so that hits
in these planes will come in coincidence, too. This is true, in particular,
for tracks going close to wires and producing big and wide signal. Still
with all the drawbacks of this crude approach one can see a noticable
changes in upper picture compared to
Fig.:run170tdcwidth-vs-time.
Other plots on
Fig.:run170cross-vs-source
present drift time spectra of two selected wires and correlation between
their drift times when both wires fire together in one event. Note, that at
zero degree angle only an unlikely hard-scattered track can pass through
both cells, so most entries in the last plot clearly originate from
crosstalk. In our interpretation diagonal band on plot comes from mutual
crosstalk of these two wires while horizontal and vertical bands come from
crosstalk with other wires/planes. Crosstalk level value can be roughly
estimated as the ration of counts in scatterplot over sum of counts in
wire's drift spectra. It typically amounts to $0.25\div 2$\% for high-energy
pions runs. Electronic crosstalk in VTX board itself is about $0.25\%$.
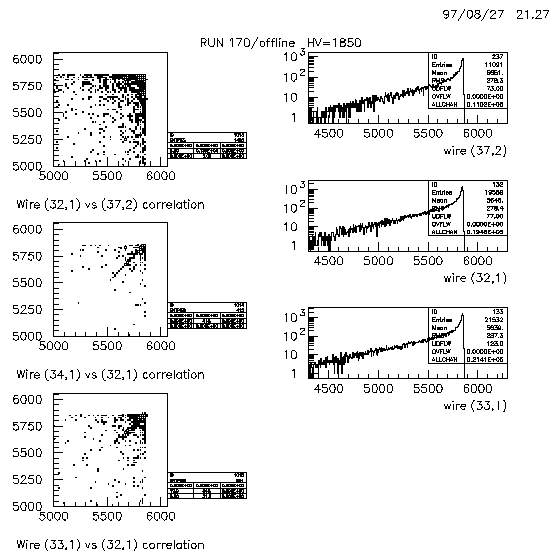
Fig:run170wwcrosstalk demonstrates much lower level of crosstalk between planes with orthogonal wires.
Figure:run170wwcrosstalk
Drift time correlations between wires in plane 1 and
plane 2 and corresponding individual wire spectra.
Since very short
(<25) channels) pulses
(see Fig:run170tdcwidth are most
likely crosstalk rather then true hits, the following cut was applied in the
the next step of run 170 analysis
(in addition to already mentioned in
Table 1
Only pulses with width >25 channels were accepted. In cases, where wire
had several hits in TDC buffer next hits were tried sequentially until
either ``wide'' pulse was found or cell marked as not fired. Results are
presented on Figures:
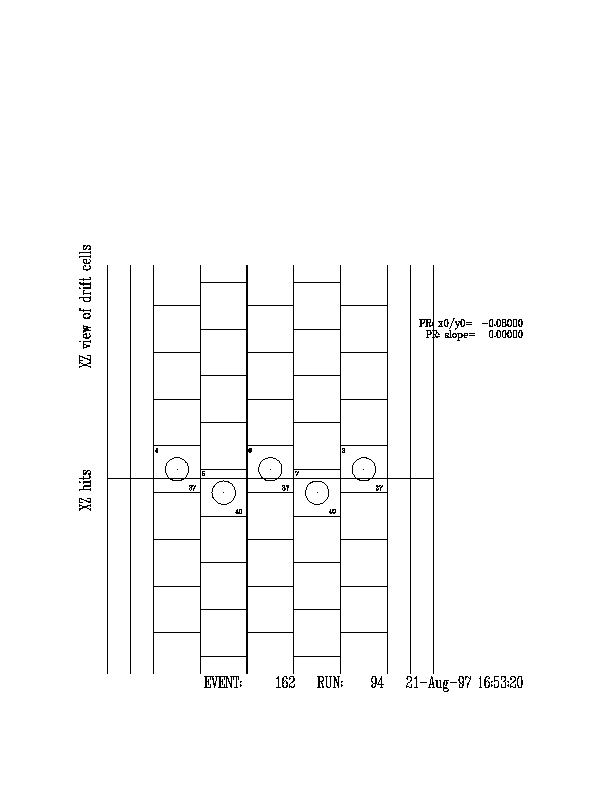
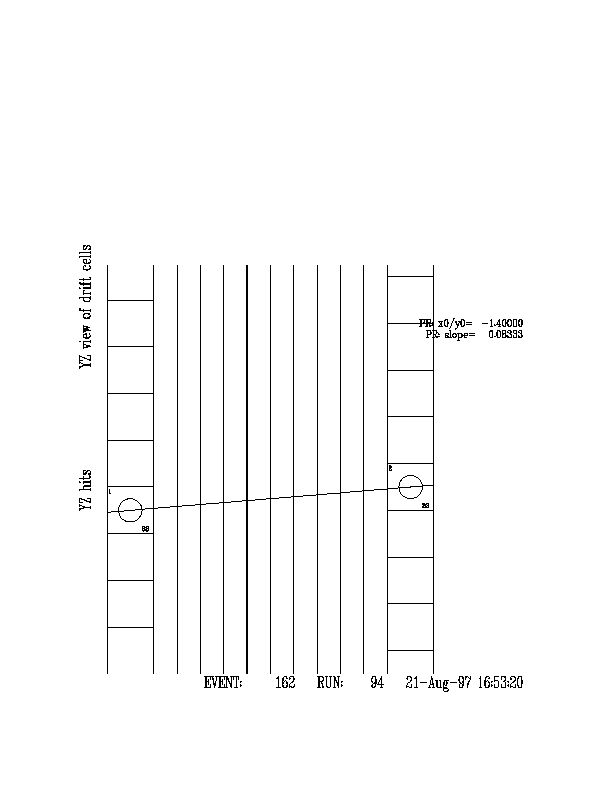
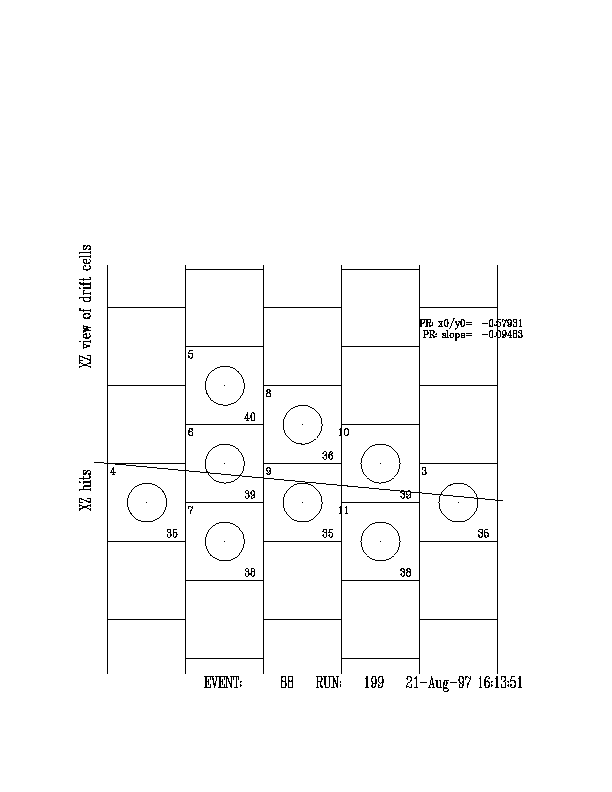
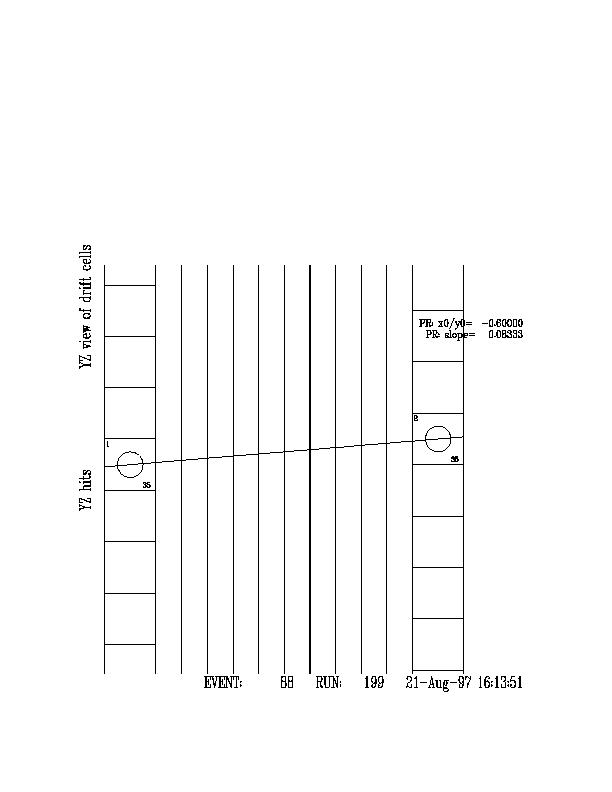
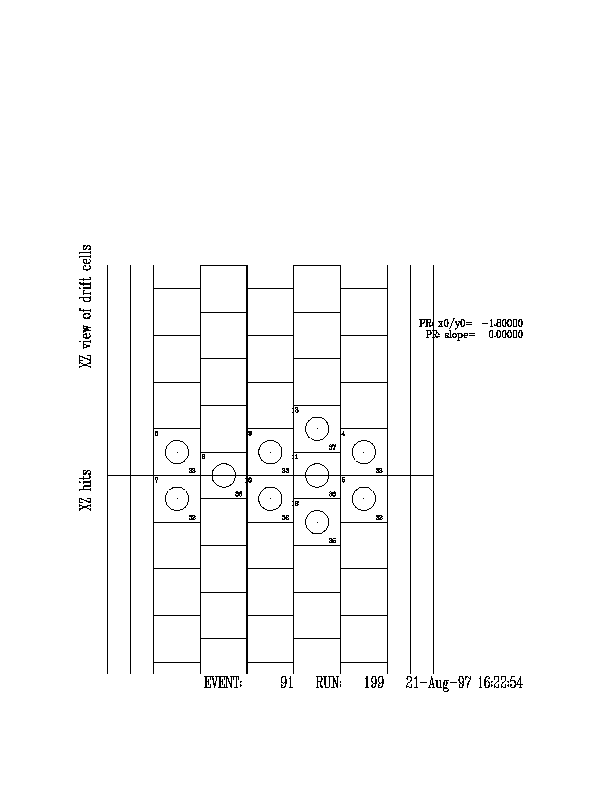
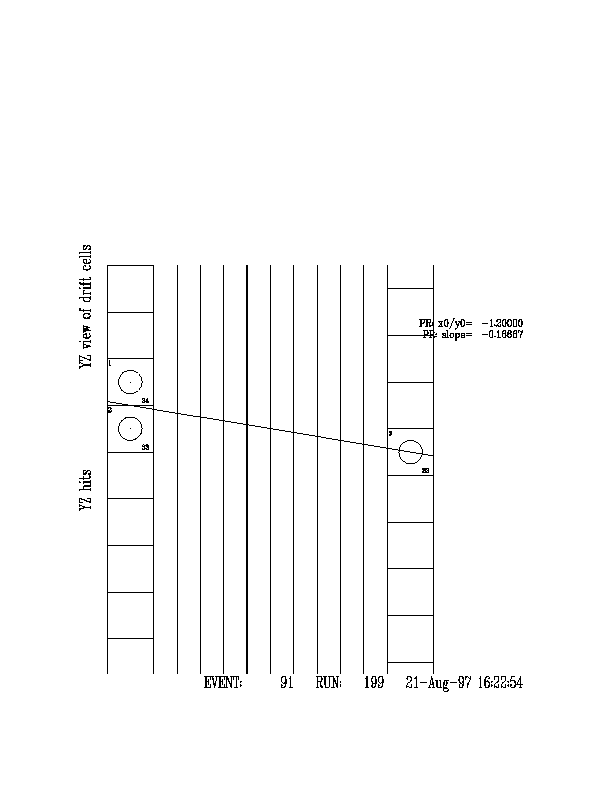
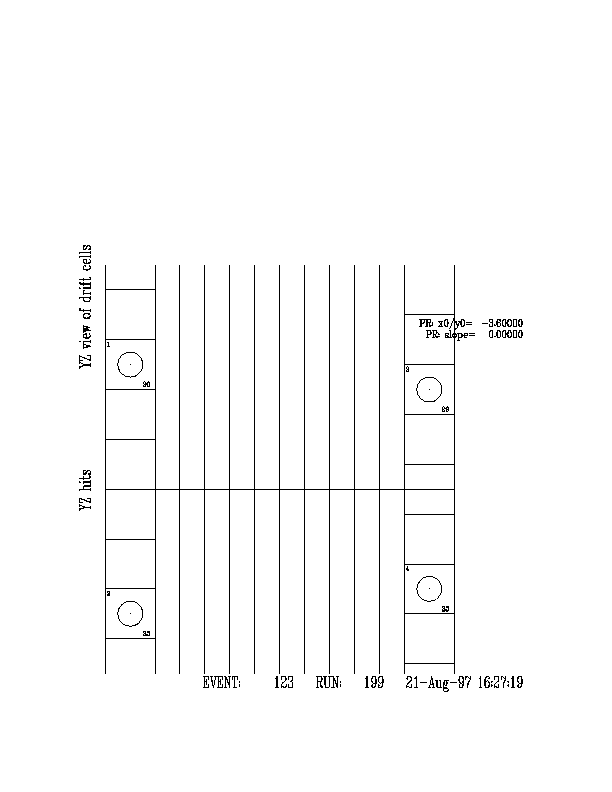
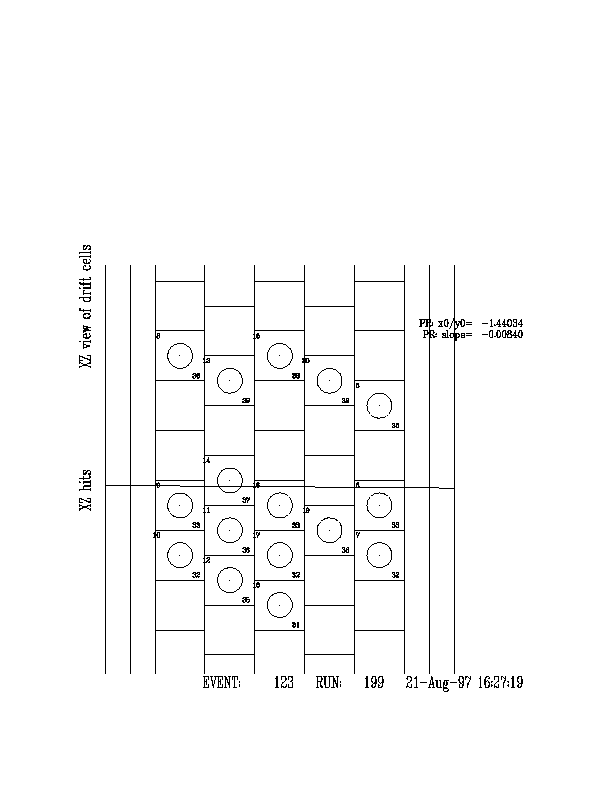
As one would expect crosstalk level for muons is much higher (10-20\%). Next figures show some typical tracks for 150 MeV/c pions (run 94) and 30 MeV/c muons (run 199) without any cuts applied. Circles on these pictures are for eye guidance only, and do not reflect real drift distances. Obviously, any reconstruction of muon tracks will not be very useful if crosstalk problem is not resolved.
|
|
|
|
|
|
|
|
Fig:run170-widthcut.width-vs-time
Same as
Fig:run170tdcwidth-vs-time,
but with cut on pulse
width applied:
only first arrived pulses with width $\ge 25$ TDC channels
are accepted as valid and put into histograms.
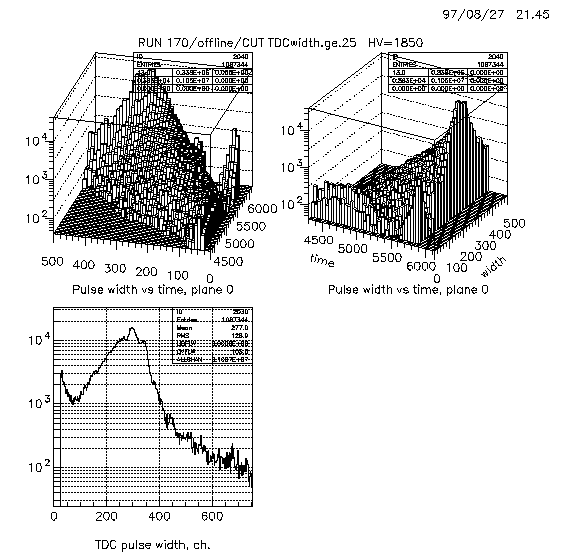
Fig:run170-widthcut.cross-vs-source
Same as Fig:run170cross ,
but with cut on pulse width applied.
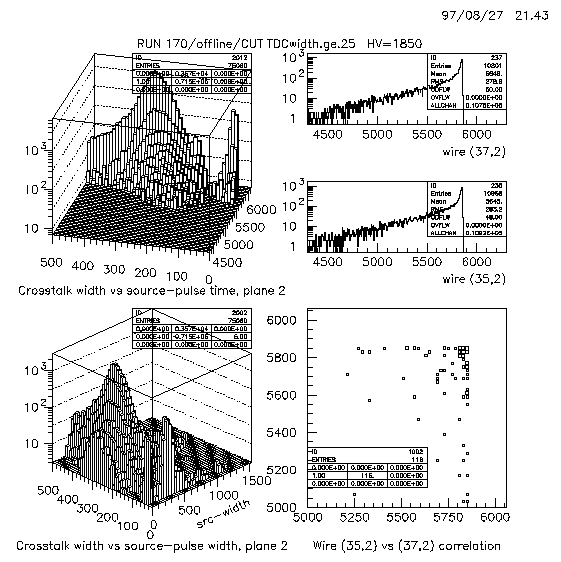
Fig:run170-widthcut.wwcrosstalk>
Same as Fig:run170wwcrosstalk,
but with cut on pulse width applied.
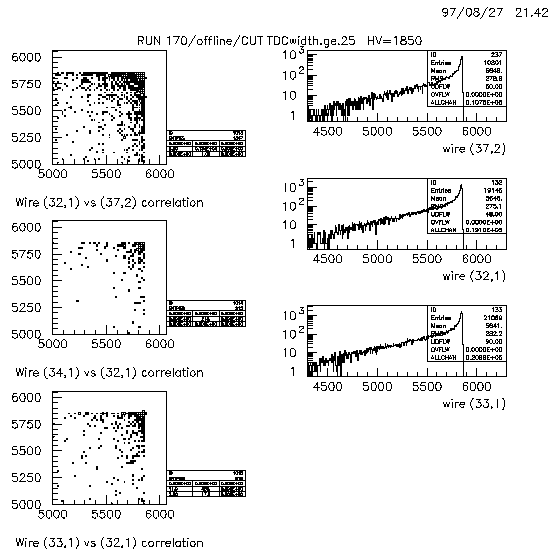
Fig:run199hits
Beam profile and number of hits distributions for $\mu^{+}$ beam at 30
MeV/c.
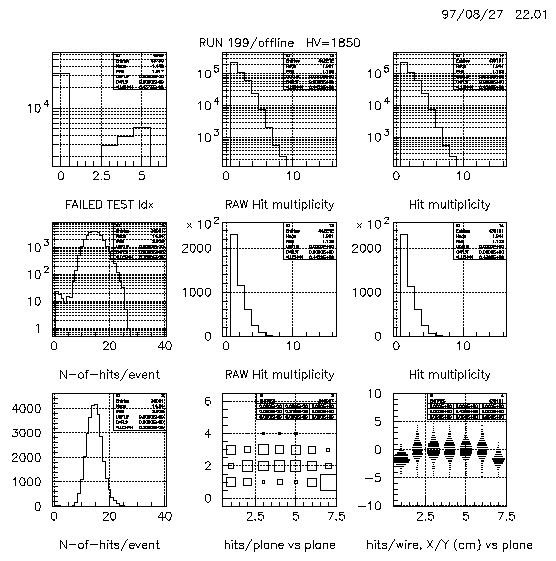
Fig:run199tdcwidth>
TDC pulse width distribution for signals from wires. Only first arrived
pulse in [0,6300] channels window is accepted and put into histogram.
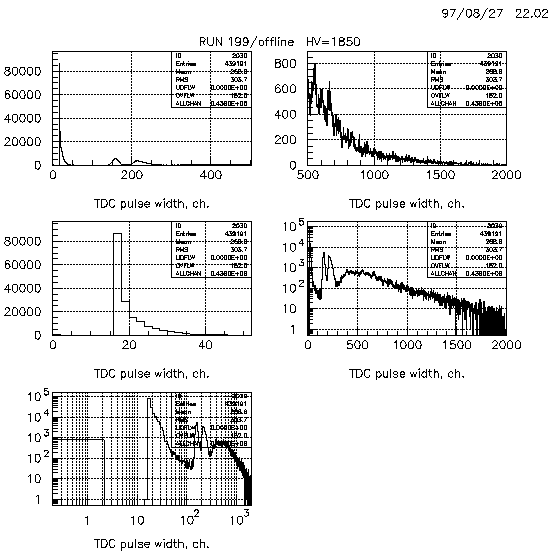
Fig:run199tdcwidth-vs-time
Correlation between the width and arrival time (TDC channel) of hits in
event.
Only one (first arrived) hit is taken for each fired wire, plane 0
means hits in all planes are put in this histogram.
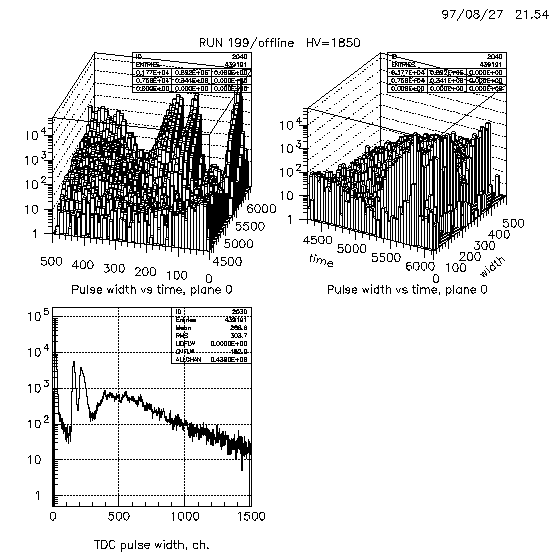
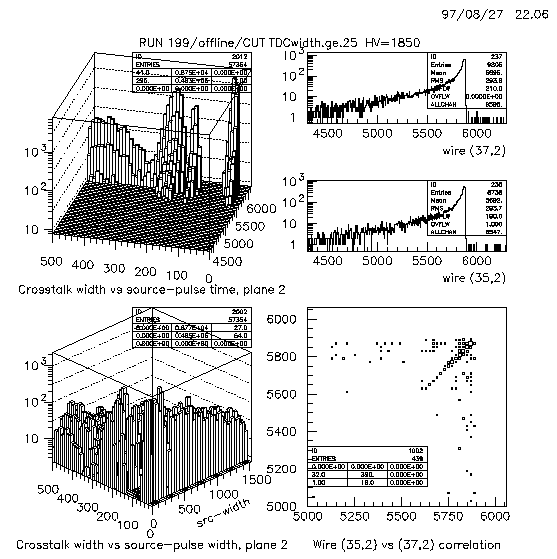
Fig:run199cross-vs-source
Width of pulses (refered as ``crosstalk'') arrived in coincidence
($\pm 10$ TDC channels) with the longest pulse
(refered as ``source'') in plane 2
versus the source pulse arrival time (upper-left) and width (lower-left).
Drift time spectra (upper-right) from selected wires in plane 2
and correlation scatterplot (lower-right) of
their drift times when both wires fired in event.
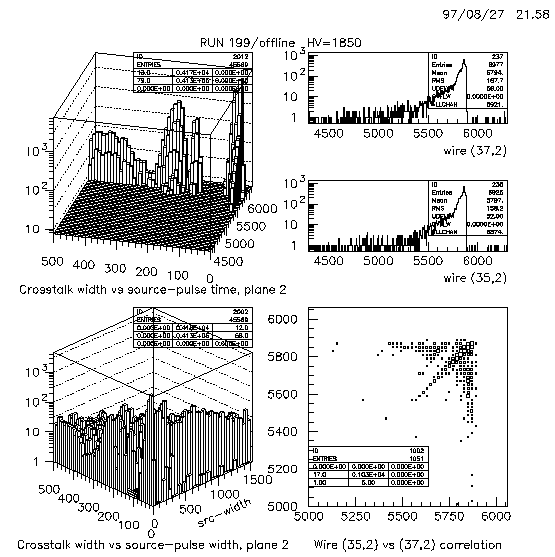
Fig:run199wwcrosstalk
Drift time correlations between wires in plane 1 and plane 2
and corresponding
individual wire spectra.
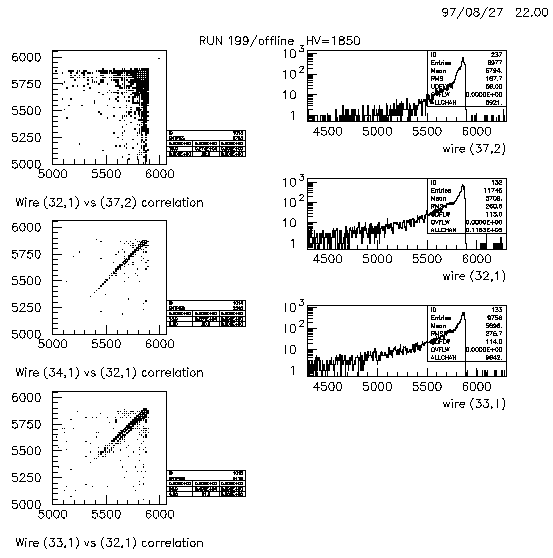
Fig:run199-widthcut.width-vs-time
Same as
Fig:run199tdcwidth-vs-time , but with cut on pulse
width applied: only first arrived pulses with width $\ge 25$ TDC channels
are accepted as valid and put into histograms.
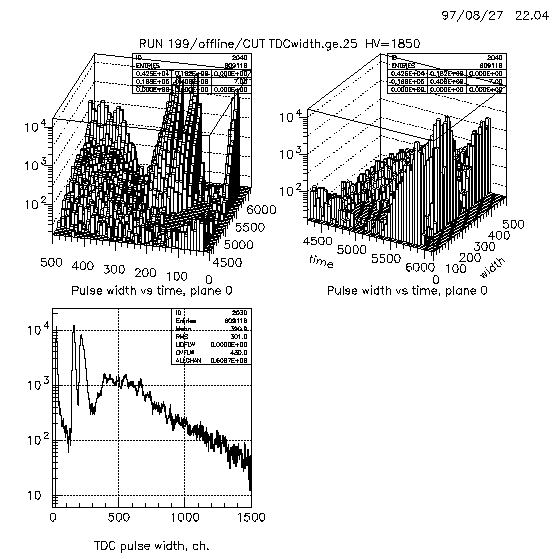
Fig:run199-widthcut.cross-vs-source
Same as
Fig:run199cross-vs-source , but with cut on pulse
width applied.
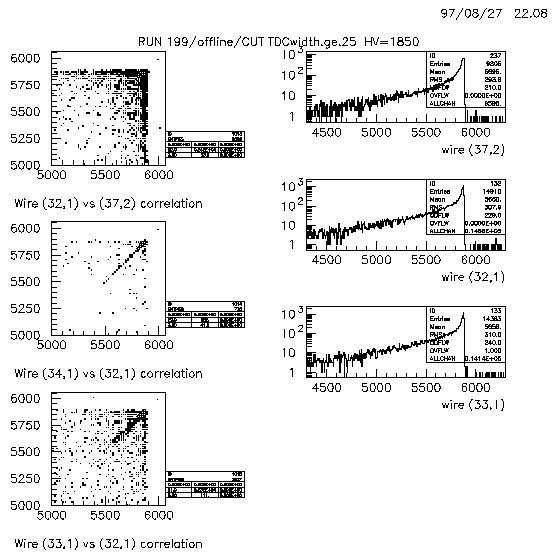
Same as
Fig:run199wwcrosstalk ,
but with cut on pulse width applied.
 Yuri Lachin, RRC "Kurchatov Institute", Moscow, Russia